Chart Question Answering Challenge
This challenge was developed by Hayoun Oh. Many thanks to Yunhai Wang for providing some of the data.
SUBMISSION INSTRUCTIONS!
IMPORTANT: We will continue the challenge after the workshop but current winners will be announced during the workshop!
The CQA challenge includes 3 levels of perception: from low-level visualization building blocks to semantic reasoning that requires text extraction.
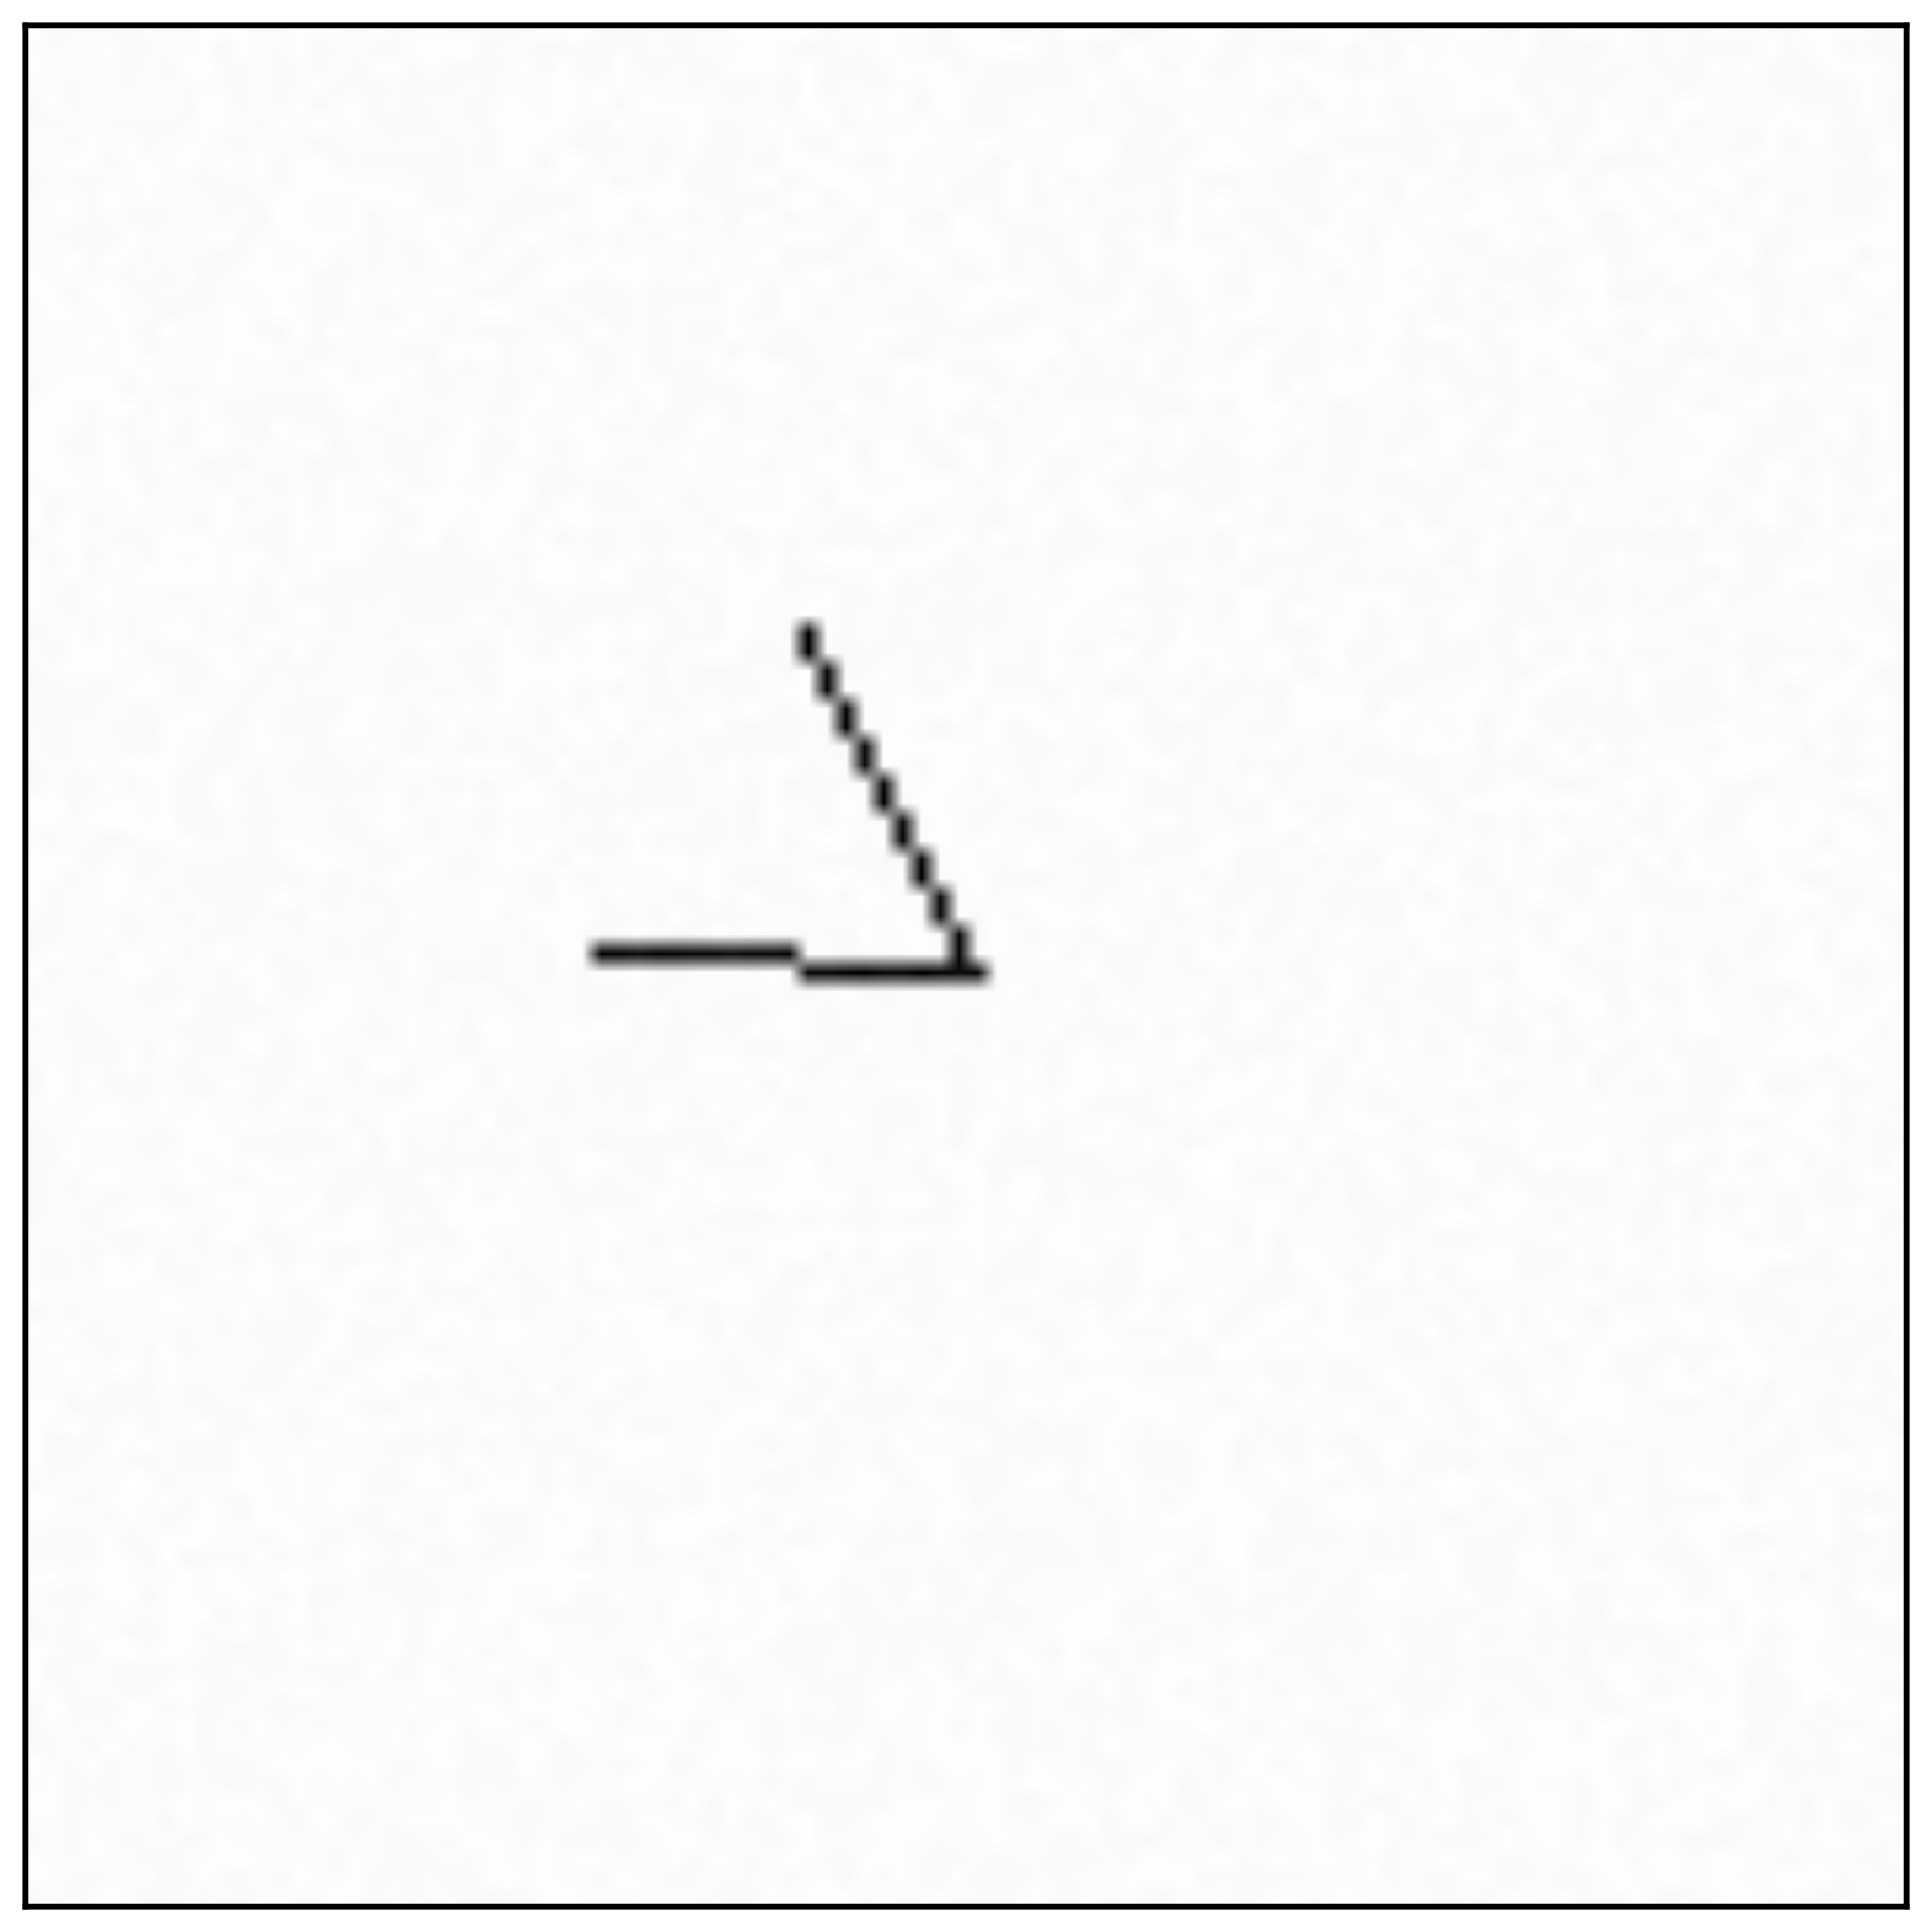
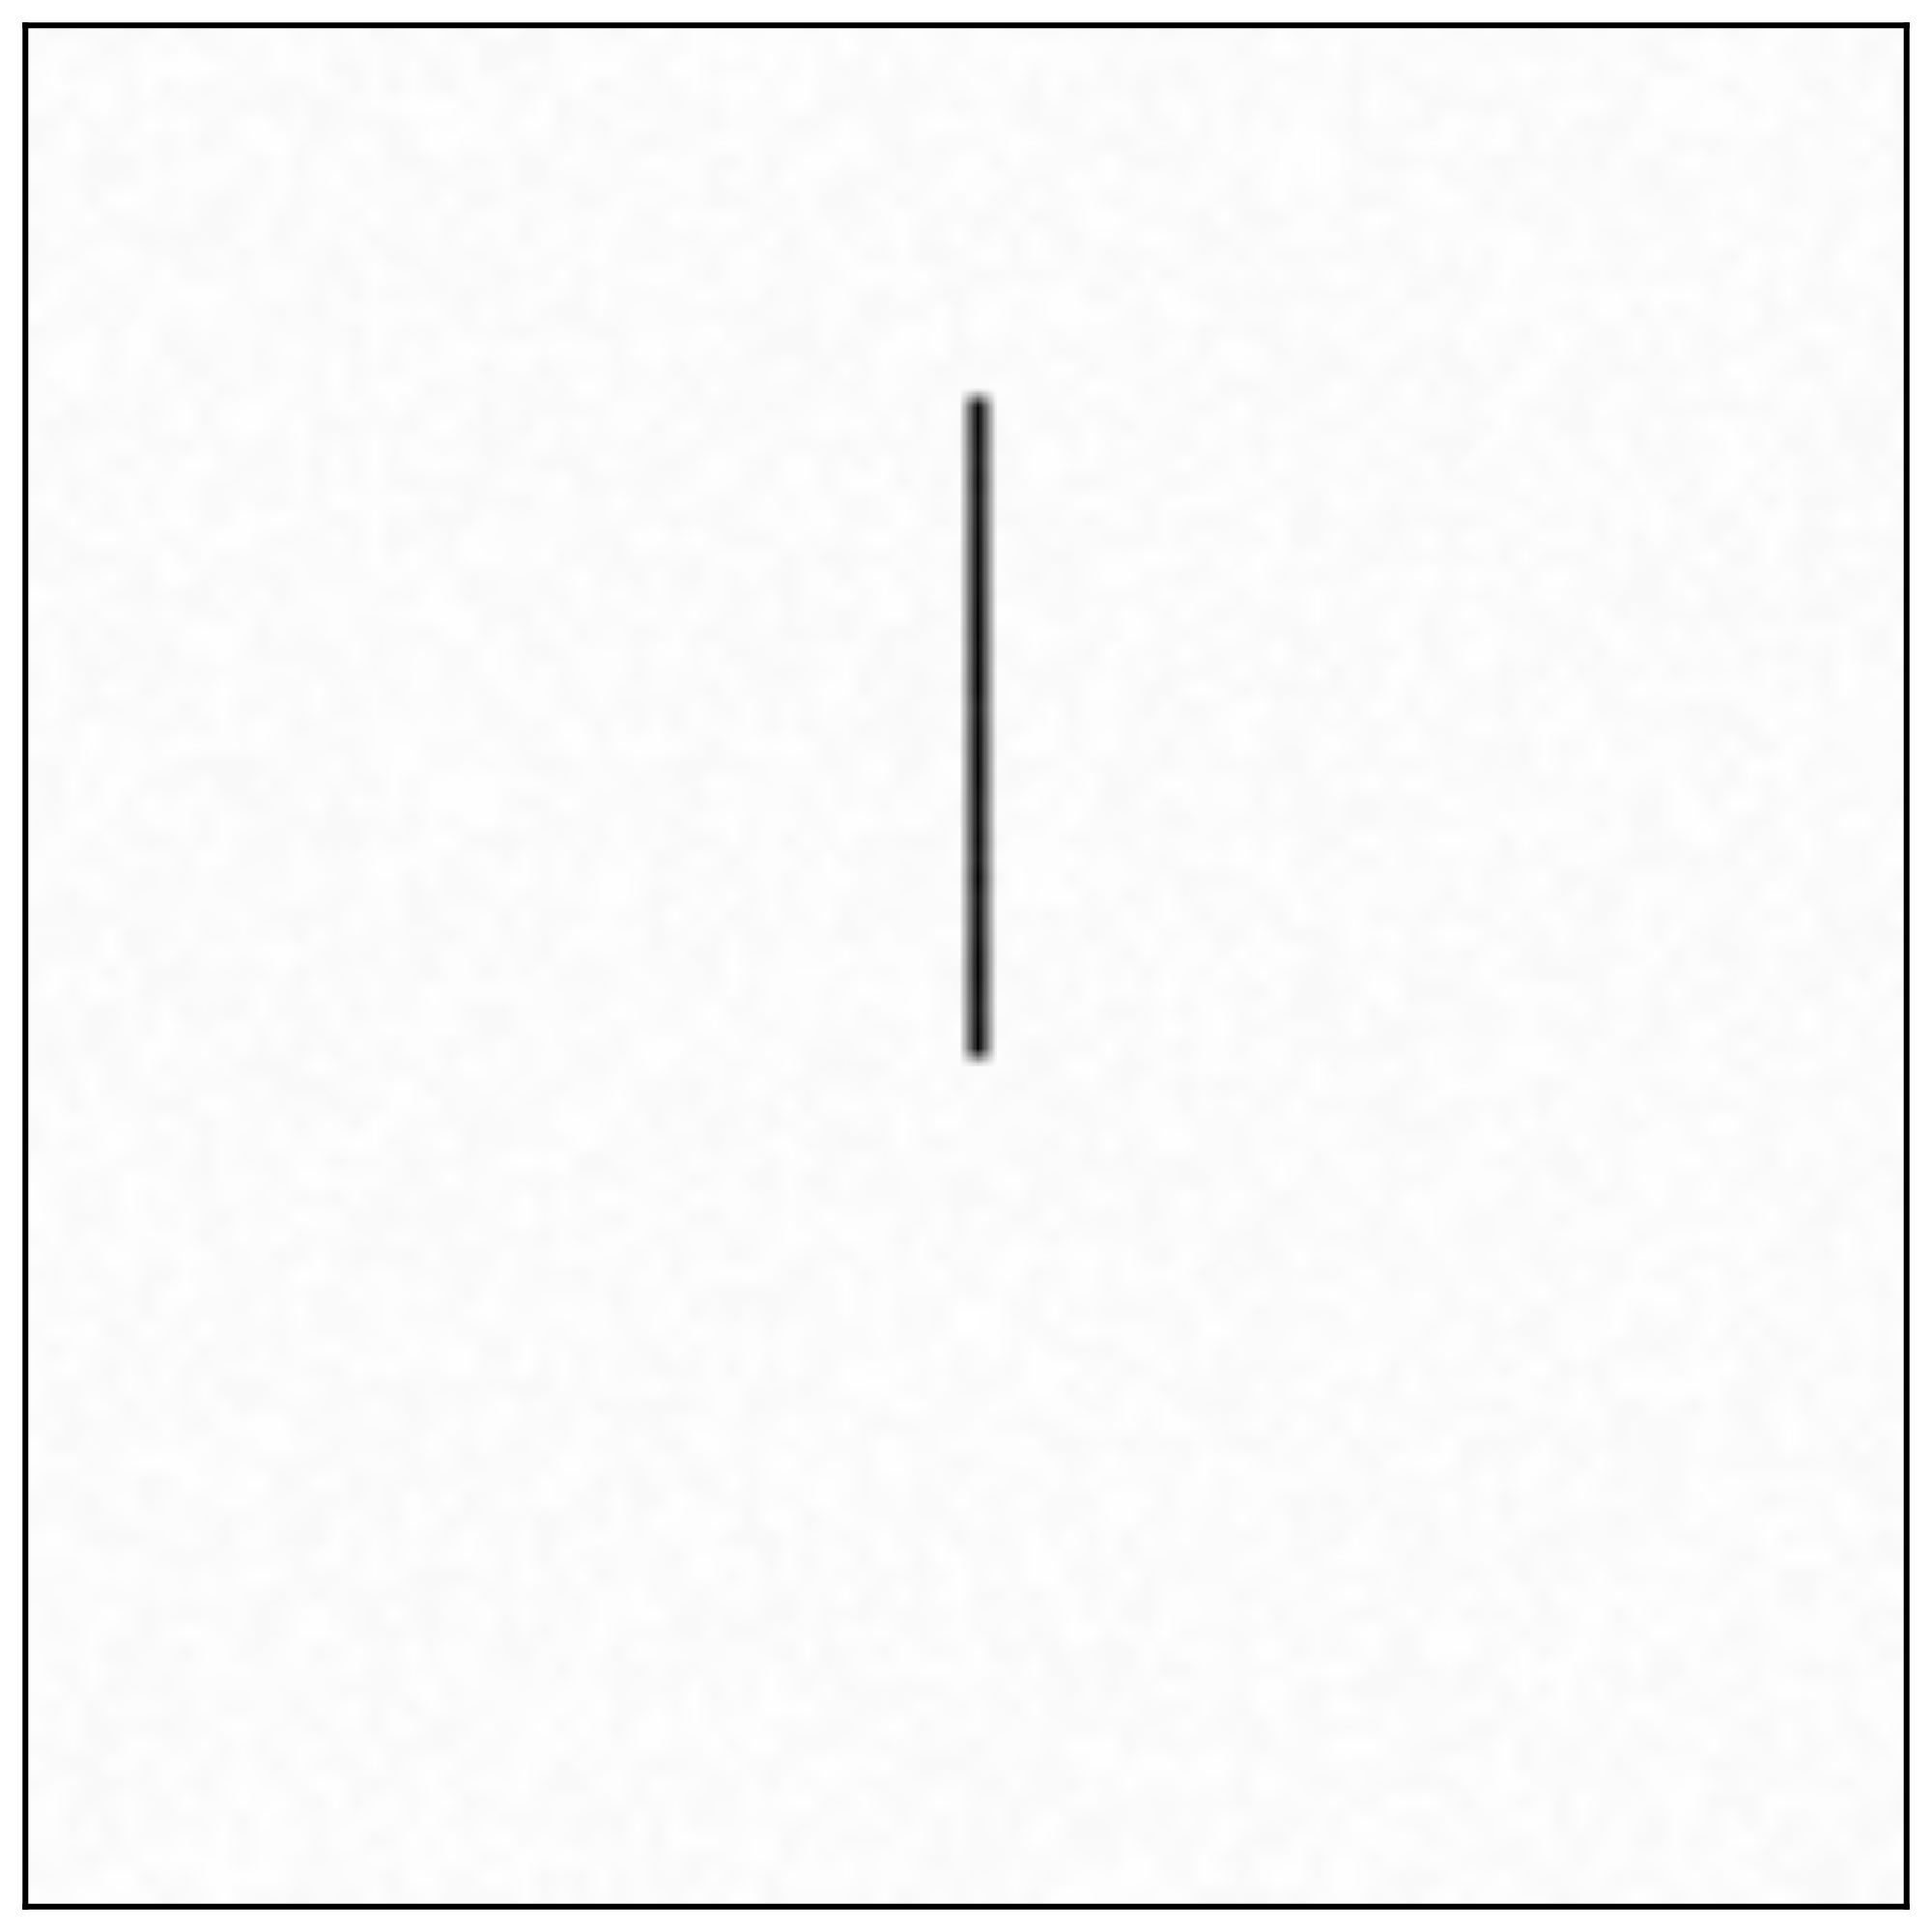
Low-level:
Can your model measure Cleveland and McGill’s 1984 Angle and Length stimuli? Does your model succeed even in cases of x-position, y-position, and stroke width variations? What about Cleveland and McGill’s 1985 images?
Training and test sets now available! DOWNLOAD HERE!
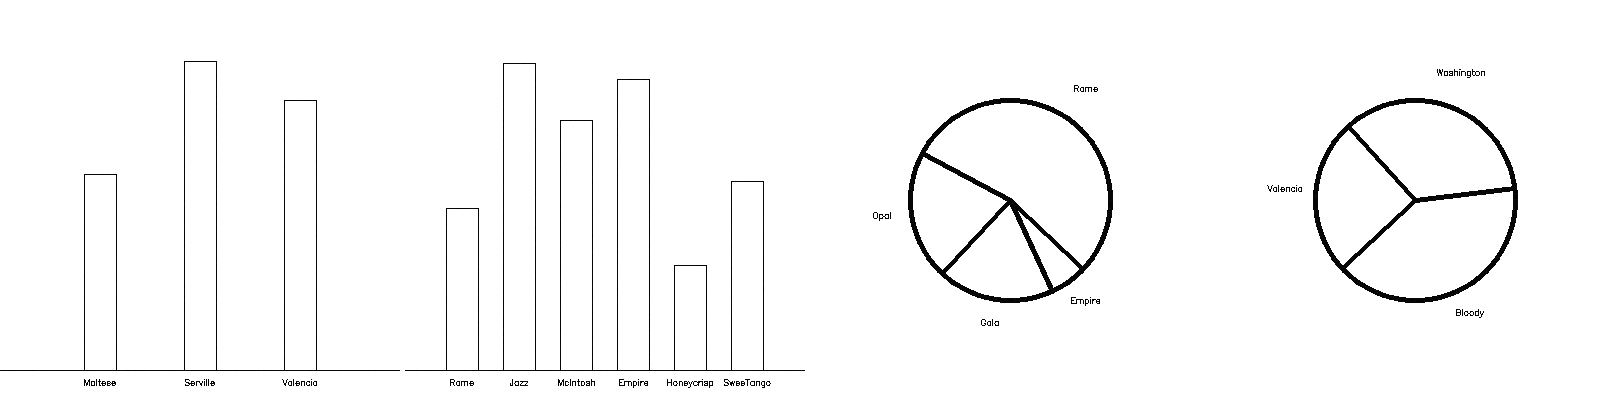
Mid-level:
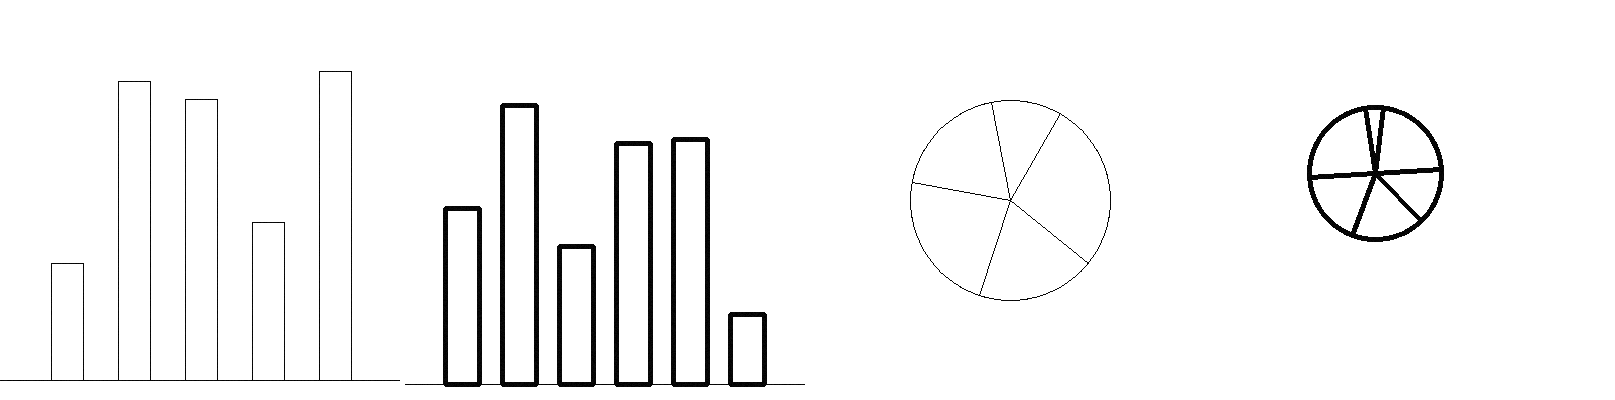
What about simple bar and pie charts? Can your model successfully compare ratios - even with stroke width variations?
Training and test sets now available! DOWNLOAD HERE!
High-level:
Now, images contain textual information. Can your model answer questions regarding the data? Can it generalize between apples and oranges?